
Our Live Carbon Dashboard. A smarter way to measure carbon
Energy can be confusing, and with climate change accelerating - understanding the carbon impact of our energy has never been more important. Our innovative Live Carbon Dashboard uses live data to show where Britain’s electricity comes from, its carbon impact, and the progress being made towards net zero 2050.

Stamp of approval
All our carbon footprinting tools have been independently validated by our third-party auditors, Pause
People. If you see this icon
,
you know it’s got their seal of approval.
Transparent Reporting
Being the change through transparent carbon reporting
We believe carbon reporting should be clear, useful and easy to access — not hidden behind complicated reports. That’s why every graph and data point on this dashboard is supported by clear explanations, helping homes and businesses better understand the energy.

Our journey
Our carbon reporting journey is split into two parts: our own operations, and the wider energy system. Separating the two gives a more honest picture of progress.

Driving impact
Focused on practical sustainability, targeting the areas where we can make the biggest impact across our sites, fleet, suppliers and people.

Full transparency
We’re championing greater transparency across the energy industry and helping customers better understand the carbon impact of the energy they use.

Live reporting
In 2024, we became the first UK energy supplier to launch a Live Carbon Dashboard, giving customers access to real-time carbon reporting.

Real data
Instead of greenwashing, we publish live carbon data so anyone can see the true carbon intensity of the electricity being used.

Smarter insights
From smart meter insights to business reporting tools, we’re helping customers better understand their energy usage and carbon impact.
Insights
Reports and resources
Our carbon reporting and data
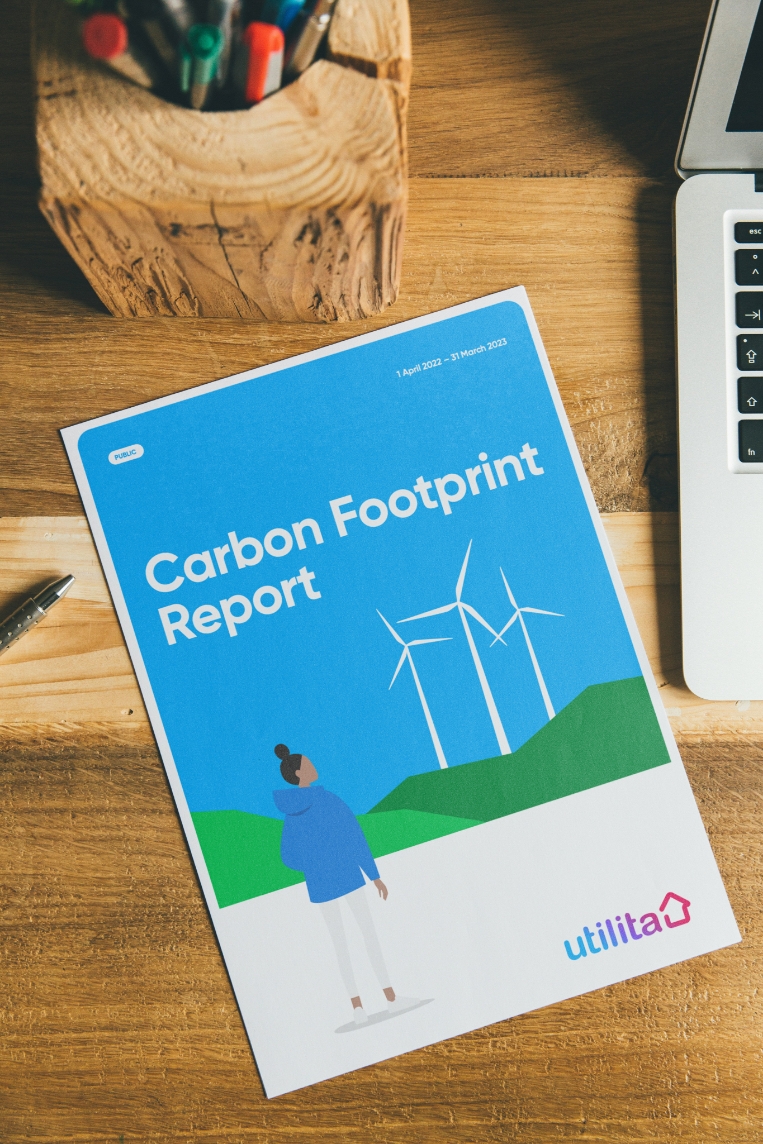
We began formally reporting our carbon emissions in 2019, publishing annual Carbon Footprint Reports to track our impact and progress.
2025/26 Carbon Footprint Report →2024/25 Carbon Footprint Report →
2023/24 Carbon Footprint Report →
2022/23 Carbon Footprint Report →
2021/22 Carbon Footprint Report →
2020/21 Carbon Footprint Report →
2019/20 Carbon Footprint Report →

From annual reports to live data
In 2024, we launched our Live Carbon Dashboard, giving customers a more transparent and real-time view of our carbon footprint. This moved us beyond a once-a-year snapshot, making our carbon data and progress more visible throughout the year.
Alongside the Live Carbon Dashboard, we continue to publish a full breakdown of our emissions and progress against our targets, including data across Scopes 1, 2 and 3. All audited and verified by trusted third parties.
Download Emissions Data Breakdown →Reporting Standards
Supporting data
We report annually against the Task Force on Climate-related Financial Disclosures (TCFD) recommendations, covering governance, strategy, risk management, and metrics and targets.
Non-Financial and Sustainability Information (NFSI) statement →Carbon accounting
Our carbon accounting figures are independently reviewed and validated by Pause People Collective Limited in accordance with ISO 14064-3 for the validation and verification of greenhouse gas assertions. They’re aligned with the GHG Protocol Corporate Accounting and Reporting Standard.
Validation Statement for Automations → Verification Statement for 2025/26 Carbon Footprint →Live Carbon Dashboard FAQs
Carbon intensity measures how much carbon dioxide (CO2) is produced to generate one kilowatt-hour (kWh) of electricity. The lower the carbon intensity, the cleaner the electricity being used. Because Britain’s electricity comes from a mix of different energy sources, carbon intensity changes throughout the day as more or less renewable energy is available.
Carbon intensity changes as the UK’s electricity mix changes. When there’s more renewable generation, carbon intensity is lower. When more fossil fuels are needed to meet demand, it increases.
Britain’s electricity is generated using a combination of energy sources, including wind, solar, nuclear, gas and imported electricity. The amount produced by each source changes throughout the day depending on factors such as weather, demand and electricity available on the National Grid. As the mix changes, so does the carbon impact of the electricity we all use.
This is the carbon intensity level needed to help keep the UK on track towards its net zero 2050 target. Comparing today’s carbon intensity against this benchmark shows whether progress is moving in the right direction.
Even if you’re on a renewable tariff, the electricity reaching your home comes from the shared National Grid. That means everyone uses the same mix of electricity being generated at that moment.
Net zero 2050 is the UK’s legal target to reduce greenhouse gas emissions as much as possible by 2050, with any remaining emissions balanced by removing an equivalent amount from the atmosphere.
Your carbon impact will change throughout the year based on your energy usage. We combine your smart meter energy usage with live carbon intensity data to estimate the carbon impact of the energy you use.
Data designated as •Live represents the latest available values, refreshed once processed and as soon as new data is accessible. It does not represent instantaneous measurement.
1 Based on the latest half-hourly intensity data available from the energy systems operator. For example, if you consumed 1kWh at a carbon intensity of 200gcCO2/kWh, it would be equivalent to driving 0.73 miles in an average diesel car. The average UK household consumes 2,700 kWh of electricity per year.
2 Based on the latest half-hourly intensity data available from the energy systems operator. Intensity targets are based on achieving a steady reduction in carbon intensity every 4 years, ensuring steady progress to net zero 2050.
3 Customer Consumption Intensity shows the actual daily carbon intensity of energy used by Utilita customers, compared to the annual intensity target. Calculated using a location-based methodology and possible thanks to over 95% of our customers being smart metered.
4 Includes all material emission sources. waste, water, employee commuting and upstream supply chain cannot be included in this automation due to current reporting limitations, however, you can see the impact of these emissions sources in our annual carbon footprint reports. This automation covers all operations from Luxion Group entities, of which Utilita Energy is the largest entity.